Test Terminal
> Run your routes directly from the Builder and see the response instantly.
The Test Terminal lets you call your route with custom parameters and see the result without switching to an external tool like curl or Postman.
Opening the terminal
The terminal is at the bottom of the Builder canvas. Click the arrow button at the bottom-left to expand or collapse it.
Running a test
1. Click the Test button in the terminal header. 2. Brickr sends a request to the dev version of your route. 3. The response appears in the terminal output.
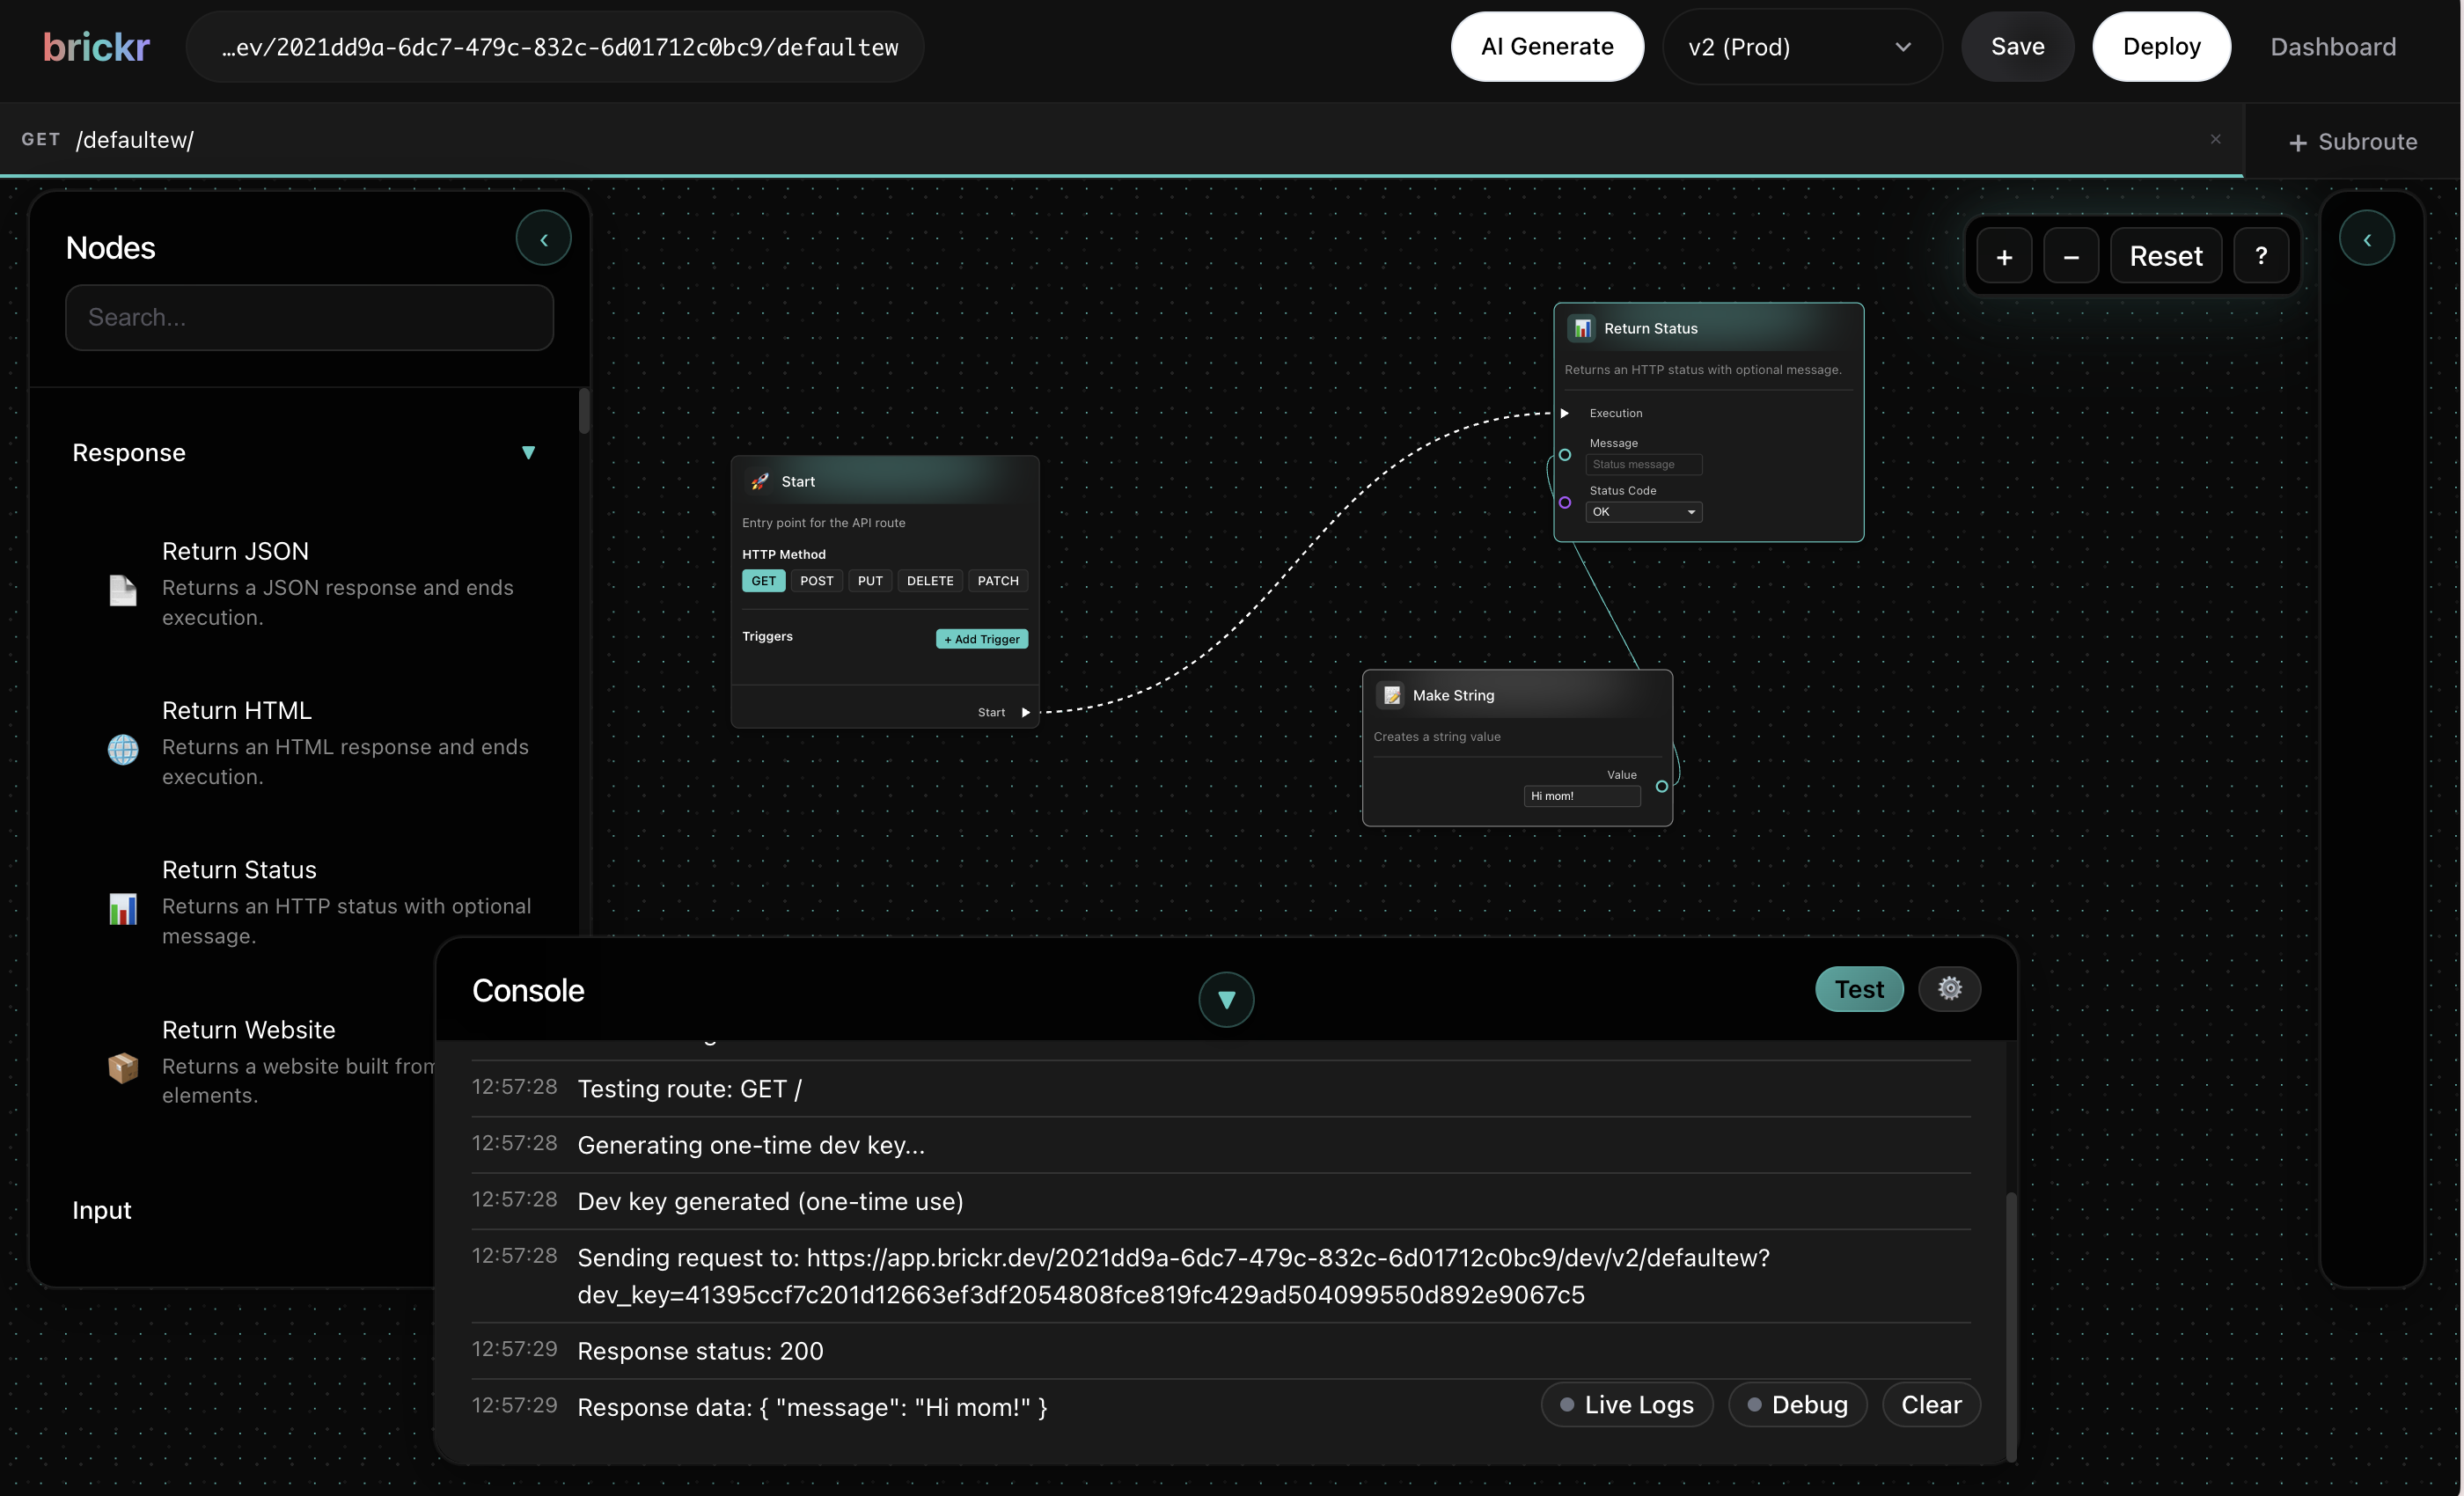
The test button adapts to your route type:
- HTTP routes -- Sends an HTTP request with the configured method
- Webhook routes -- Sends a simulated webhook payload
- Cron routes -- Triggers the scheduled job immediately
- Functions -- Executes the function with test inputs
Test executions do not count toward your daily API usage limits. The only exception is AI nodes -- their usage still counts toward your AI quota.
Setting test parameters
Click the gear icon next to the Test button to open the parameter editor. You can configure:
| Tab | Description | |-----|-------------| | Query | URL query parameters (e.g., ?name=John) | | Headers | HTTP headers (e.g., Content-Type: application/json) | | Body | Request body (JSON) | | Path | Path parameters (e.g., :id) |
For each parameter type: 1. Click Add Parameter. 2. Enter a Key and Value. 3. Click Apply when done.
Parameters are saved between sessions so you do not have to re-enter them every time.
Testing from Brickr Assistant
Brickr Assistant can prepare and run the route that is currently open in the Builder. When it requests a test, Brickr writes its query, header, body, and path values into this same parameter editor, so you can inspect and reuse them after the run.
The Builder saves unsaved graph changes before starting the request and stops if that save fails. Assistant tests always target the current DEV route, wait for the response, and return a redacted, size-limited result to the chat. They never call the production route.
Reading the output
Each log entry in the terminal shows:
- Timestamp -- When the entry was logged
- Type badge -- INFO (blue), SUCCESS (green), or ERROR (red)
- Message -- The log content
JSON responses are pretty-printed for readability. HTML responses are shown in an embedded preview.
The terminal also shows the HTTP status code and which parameters were used for the request.
Use the Test Terminal together with Debug Mode to see exactly what happened inside your flow during the test.
What's next?
| Topic | Description | |-------|-------------| | Debug Mode | Trace execution path and inspect pin values | | Live Logs | Stream real-time logs from production | | Brickr Assistant | Ask questions and run the current DEV route from chat | | Visual Editor | Builder interface reference |